
Survey: Up to 40% of Americans don’t know that our population is growing
Survey findings
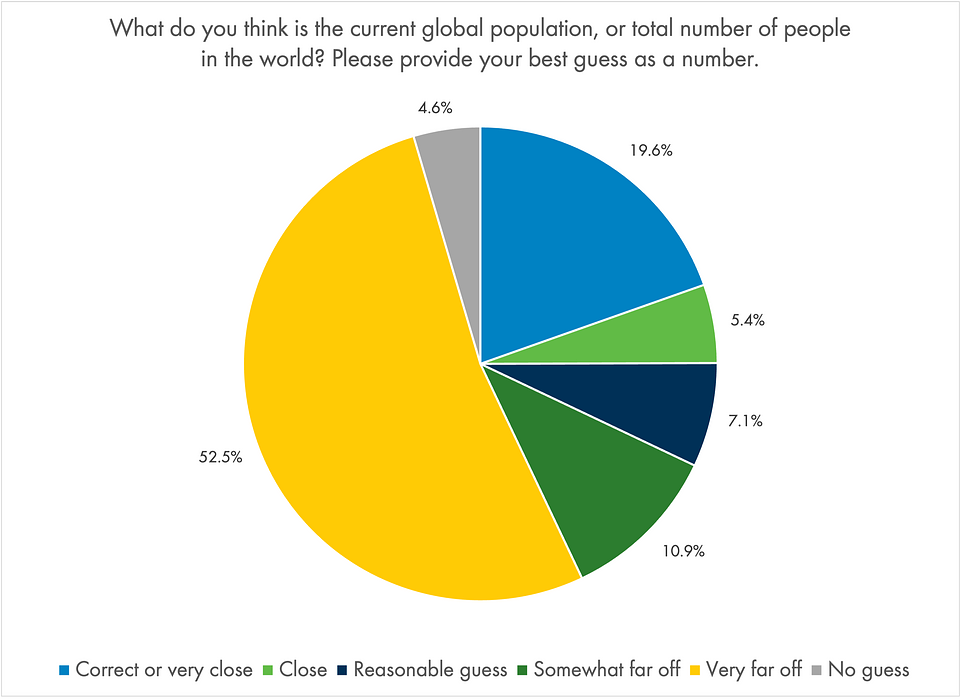
![[Answers were coded as follows: Correct or very close: within 5% of the actual population size, Close: within 10%, Reasonable guess: within 20%, Somewhat far off: within 50%, Very far off: off by more than 50%]](https://prowly-prod.s3.eu-west-1.amazonaws.com/uploads/47269/assets/760364/large-484abc3d38586674a947355e0fe831ff.png)
[Answers were coded as follows: Correct or very close: within 5% of the actual population size, Close: within 10%, Reasonable guess: within 20%, Somewhat far off: within 50%, Very far off: off by more than 50%]
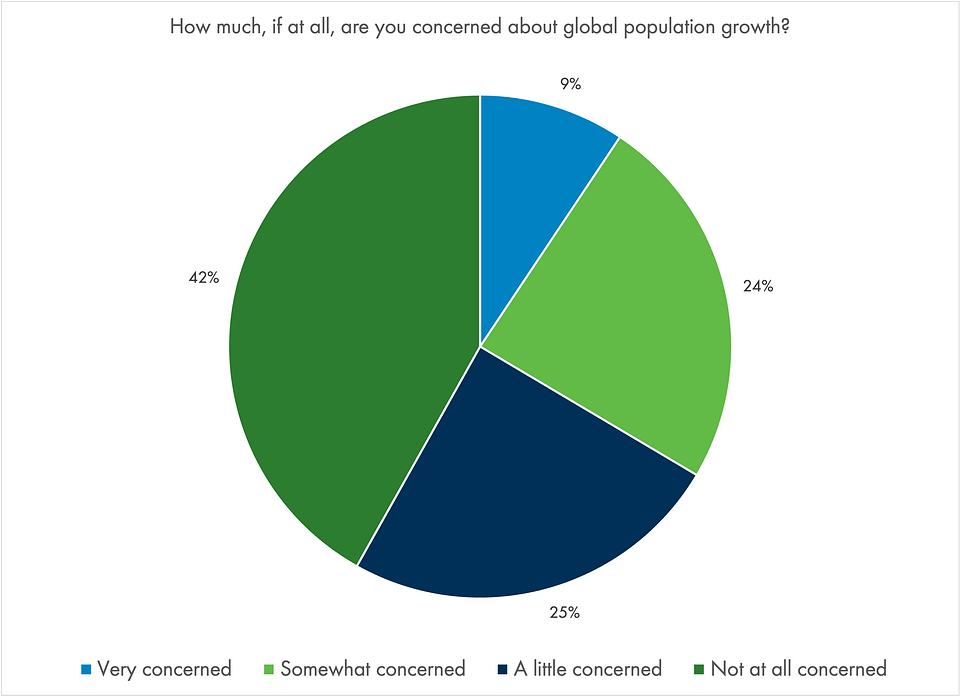
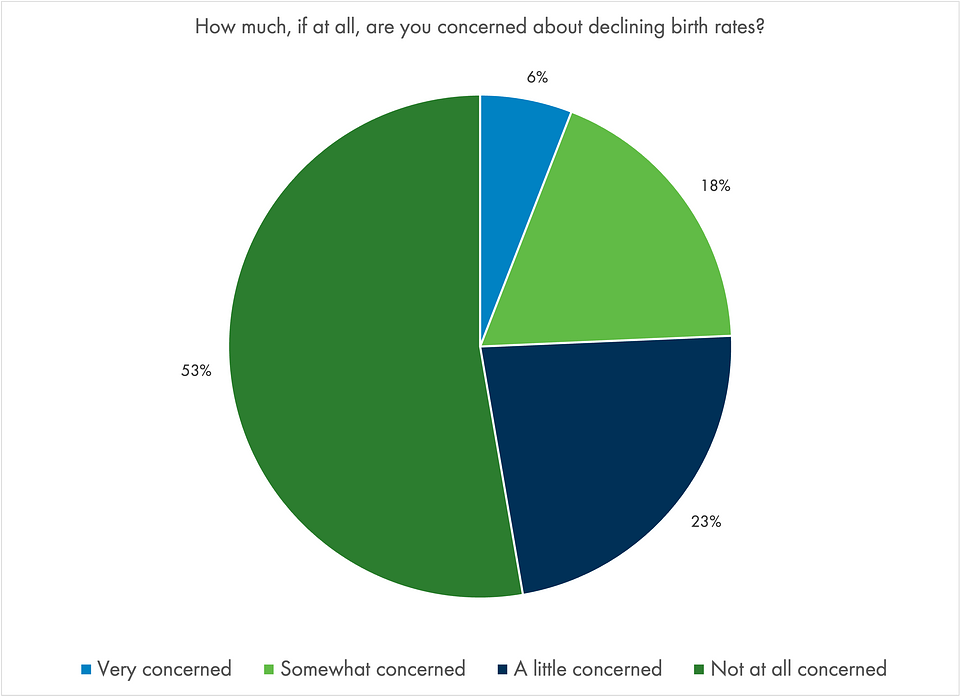
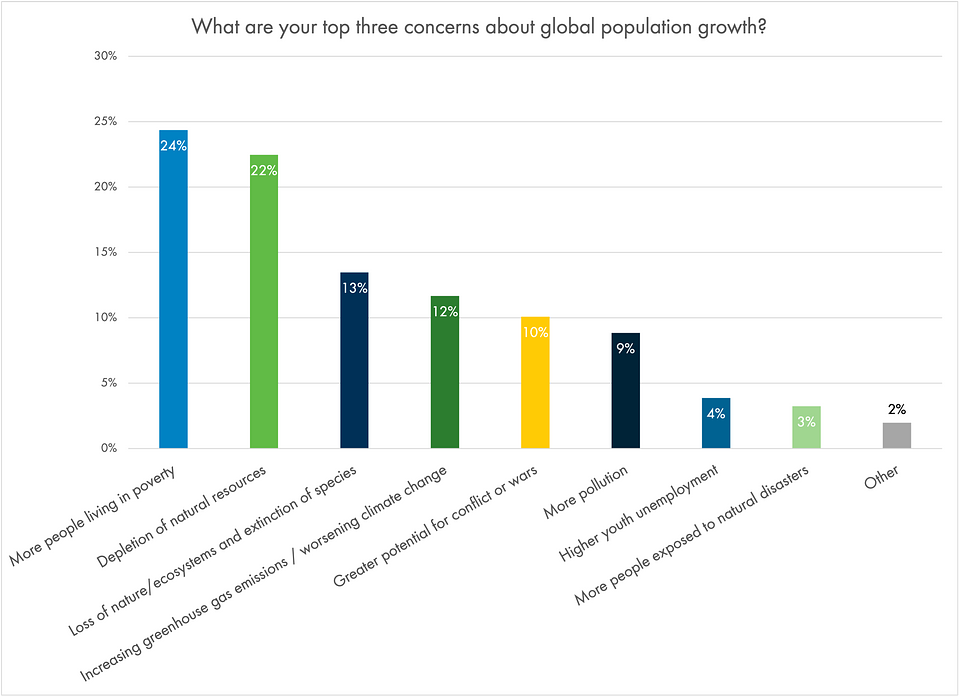
![[Figures show the breakdown of respondents' concerns ranked 1 out of their top 3.]](https://prowly-prod.s3.eu-west-1.amazonaws.com/uploads/47269/assets/760371/large-ee1a6be7b4655a9b90227a7b77665fcc.png)
[Figures show the breakdown of respondents' concerns ranked 1 out of their top 3.]
A more detailed analysis of the survey results can be found on our website, alongside links to the full results tables.
Washington, DC 20037
Notes for editors
1. World Population Day (July 11) is a United Nations observance day intended to focus attention on the urgency and importance of population issues. It was first marked in 1990 in more than 90 countries. https://www.un.org/en/observances/world-population-day/background
Survey methodology:
Between June 13, 2025, and June 25, 2025, YouGov interviewed 2038 respondents who were then matched down to a sample of 2000 to produce the final dataset. The respondents were matched to a sampling frame on gender, age, race, and education. The sampling frame is a politically representative "modeled frame" of US adults, based upon the American Community Survey (ACS) public use microdata file, public voter file records, the 2020 Current Population Survey (CPS) Voting and Registration supplements, the 2020 National Election Pool (NEP) exit poll, and the 2020 CES surveys, including demographics and 2020 presidential vote. The matched cases were weighted to the sampling frame using propensity scores. The matched cases and the frame were combined and a logistic regression was estimated for inclusion in the frame. The propensity score function included age, gender, race/ethnicity, years of education, region, and home ownership status. The propensity scores were grouped into deciles of the estimated propensity score in the frame and post-stratified according to these deciles. The weights were then post-stratified on 2020 and 2024 presidential vote choice, as well as a four-way stratification of gender, age (4-categories), race (4-categories), and education (4-categories), to produce the final weight.